Who Takes Calculus Courses? An Analysis of CRDC Data From 2011-2021
Calculus, Opportunity, and Equity
Math is a core part of education in the U.S. (and globally) and provides a mechanism for students to learn problem solving skills. Often times, however, the value of math education gets lost in what Just Equations calls the “race to calculus”; school districts’ math curriculum often revolve around moving students from algebra, to geometry, to calculus, regardless of career path. This often keeps students in “tracks” where they must move sequentially through math courses based on math performance long before they even get to calculus.
The importance of calculus can be overstated at times, though, either explicitly or implicitly. Calculus has been used as a proxy for college-readiness, despite it not being relevant for all fields nor equitable preparation for it available to all students. In fact, a recent position statement from professional math organizations has cautioned against a rush to calculus by 12th grade, but instead focus on broader math preparation in high schools. This over-emphasis on math has led to widespread anxiety towards math, which is associated with lower math performance. Stereotypes also create misconceptions about who is “fit” for higher-level math, with some students believing they are “not math people” or having little confidence in their math abilities. For example, this is more likely to affect female students.
Despite this, however, taking calculus in high school can influence students’ future opportunities even though calculus classes are not offered at all public high schools. We analyzed harmonized data from the U.S Department of Education Office for Civil Rights’ Civil Rights Data Collection (CRDC) to see where calculus is offered, and who is enrolled in those places where it is offered.[1]
Where is Calculus Offered?
In our analysis of CRDC data, we found that of 13,017 school districts with a high school in 2021, there were 5,636 that do not offer a calculus class at any school within their boundary; that is, over 2 in 5 school districts are unable to offer calculus to students at any school. It is likely that these districts are relatively smaller in enrollment. The pattern of which state’s school districts offer calculus, like so many others, is not spatially random. High school students in states like Mississippi, Arkansas, and the Dakotas attend schools in districts without calculus at higher rates. By contrast, in 28 states, 10% or fewer students were enrolled in districts that did not offer any calculus classes.
Figure 1.
Percentage of High School Students By State Attending a School District With No Calculus
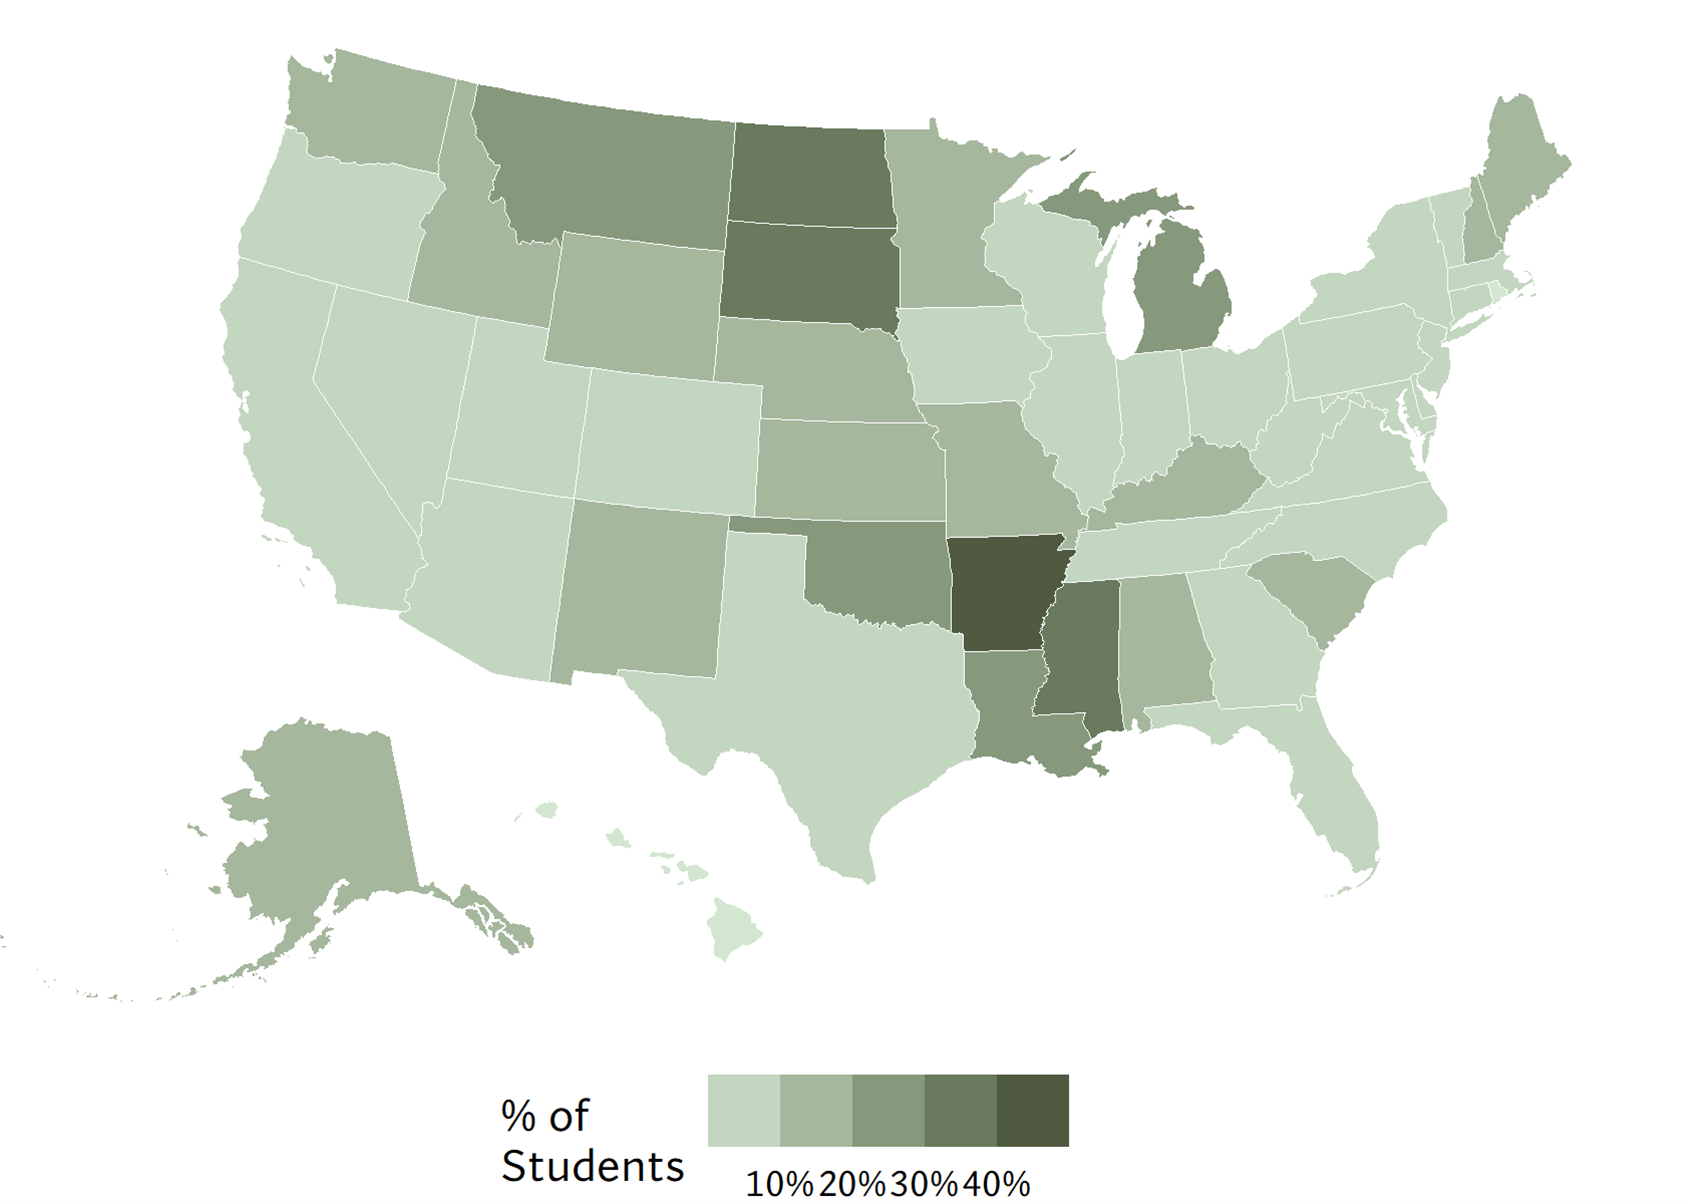
Source: H-CRDC V2.0 (2021-22) and Common Core of Data (2021-22).
We also explored whether access to calculus was related to whether a school district is classified as urban, suburban, or rural. And, for the decade studied, a lower percentage of students enrolled in a rural school districts are in a district with at least one calculus course. Students living in an urban or suburban school district, on the other hand, are much likelier to live in a school district with calculus. In fact, for most of the decade, suburban students had the highest access to calculus in their district, peaking at 95% of all suburban students in 2017.
Figure 2.
Percentage of Students With Access to a Calculus Course
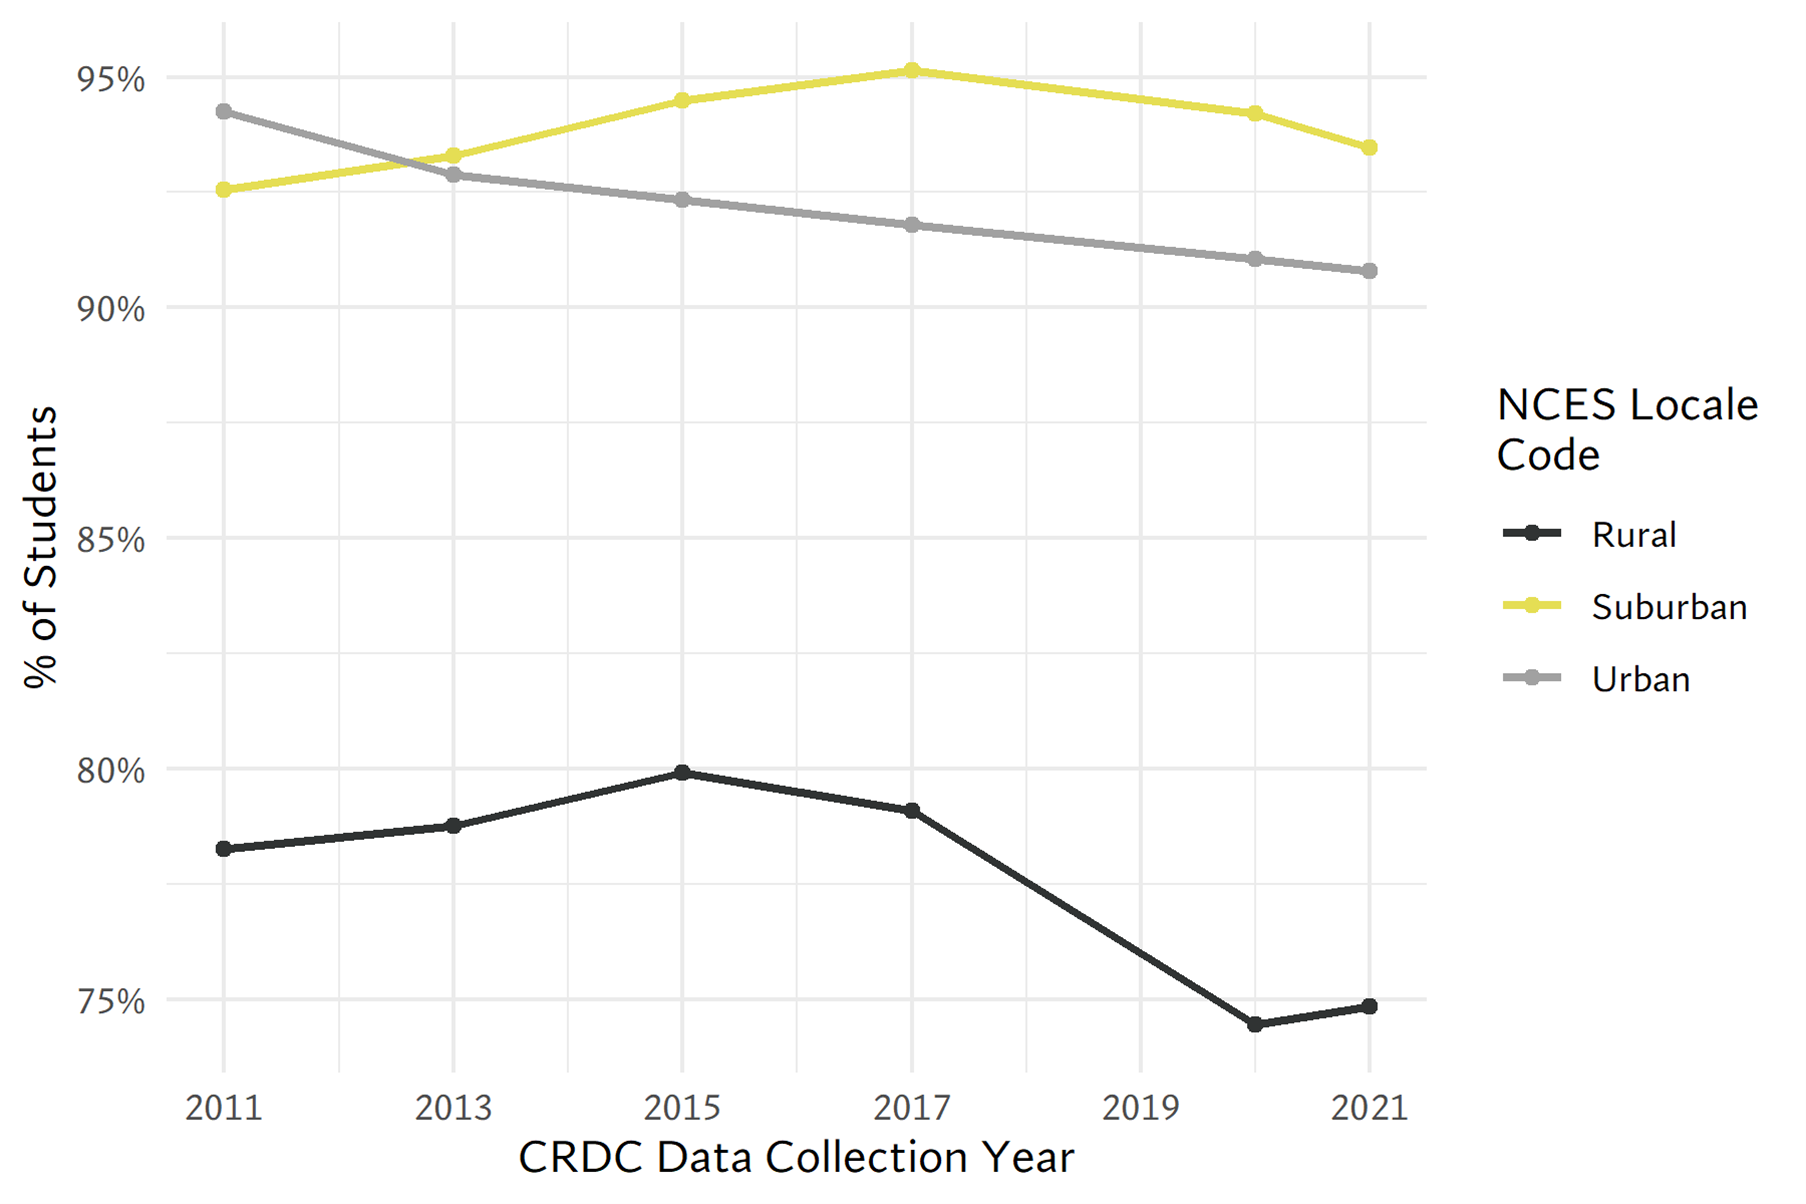
Source: H-CRDC V2.0 (2021-22) and Common Core of Data (2021-22).
When we look at these patterns at the school level, we see variation by student race as well. A larger percentage of Black students nationwide attend a school that does not offer calculus compared to students of other races/ethnicities. While there was a dip in the mid-2010s, this was part of a broader decline in calculus course enrollment beginning in the mid-2010s that can be seen in other ethnoracial groups in Figure 3 and in each locale in Figure 2. Since 2020, more than 30% of Black students attended a school that did not offer calculus, while the comparable rate for white students was just over 20% and between 10-12% for Asian students. In other words, the proportion of Black students that attended a school without calculus during the decade studied was always substantially higher than for other ethnoracial groups[i].
Figure 3.
Percentage of Students by Race/Ethnicity Attending a School Not Offering Calculus
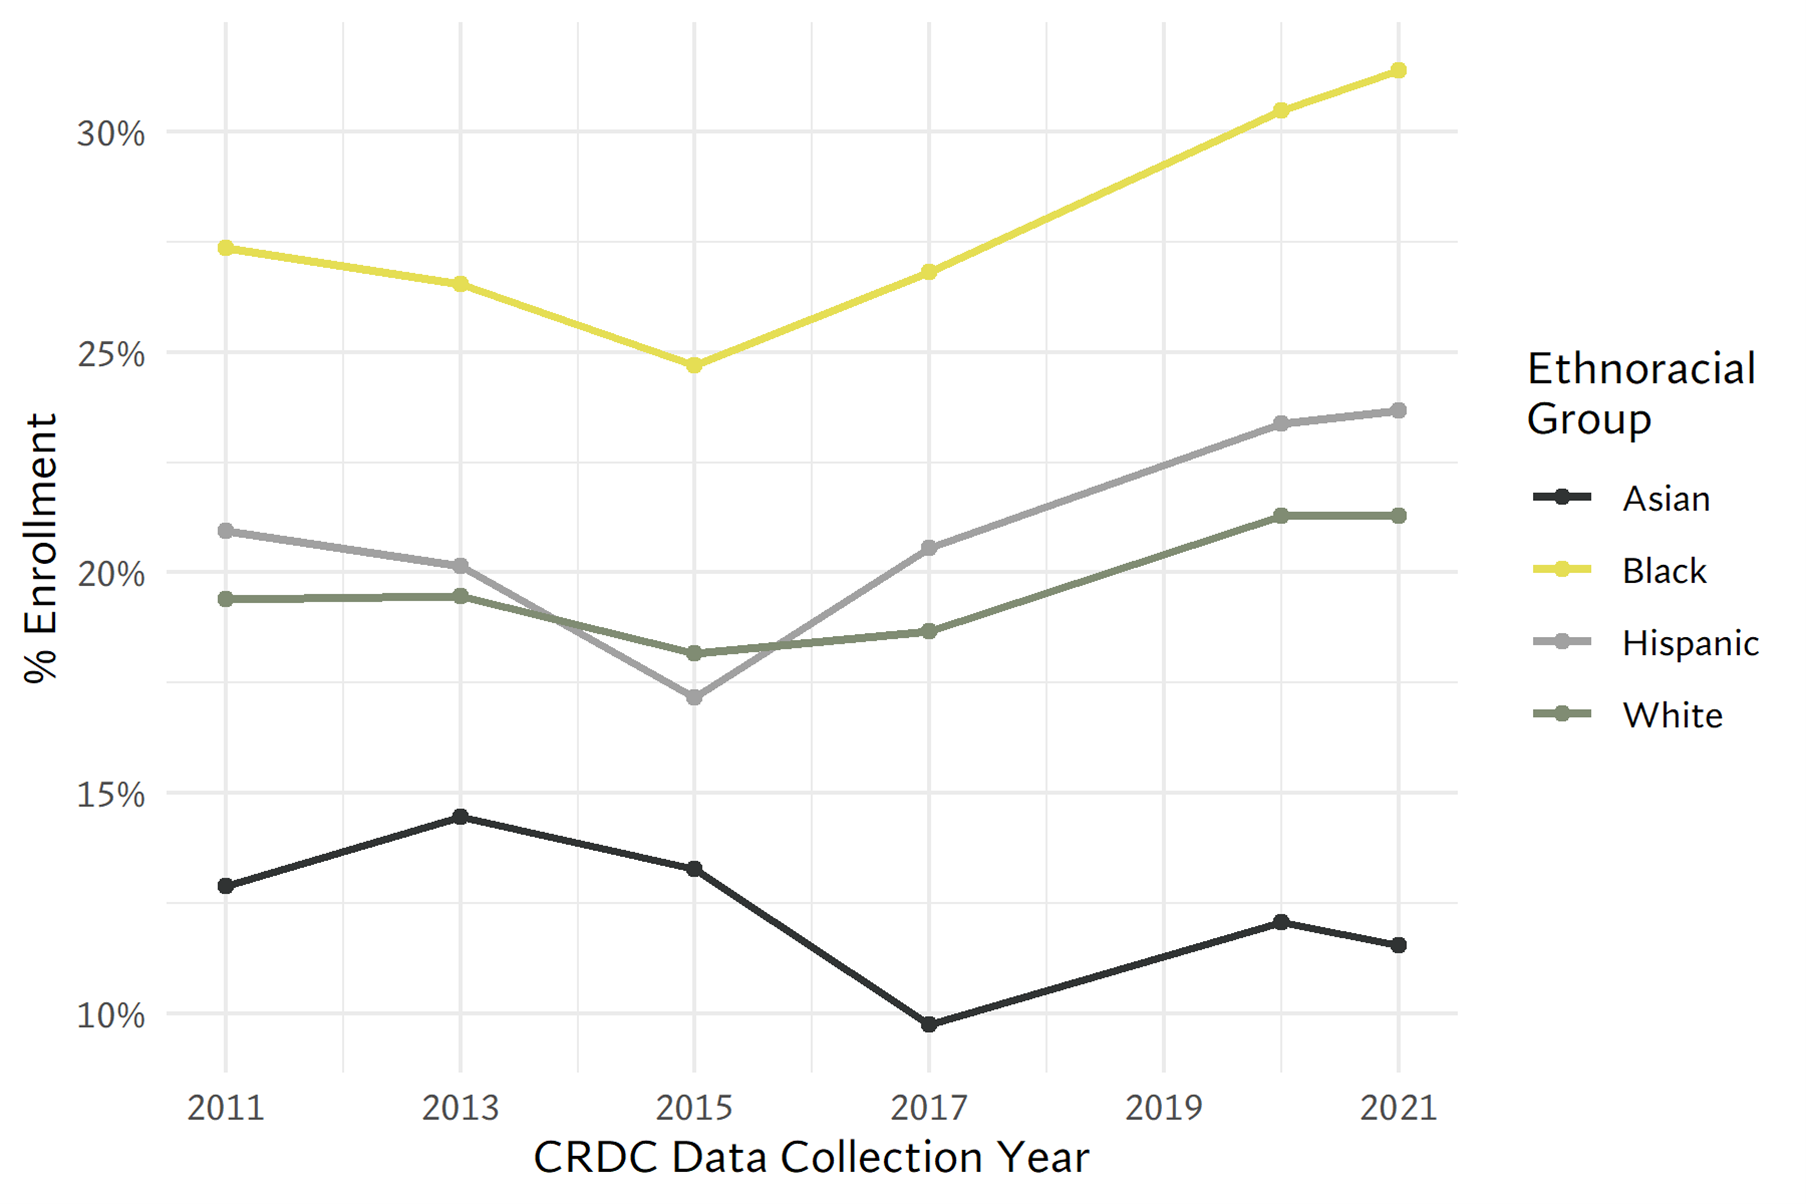
Source: H-CRDC V2.0 (2021-22) and Common Core of Data (2021-22).
One reason for this gap in attending a school with calculus may be related to a school’s racial composition. Considerably lower percentages of schools with low concentrations of Black and Hispanic students did not offer calculus than do schools with high Black and Hispanic enrollment.[i] In 2011, 60% of high Black and Hispanic high schools did not offer calculus while less than 40% of low Black and Hispanic schools did not. The percentage of both types of schools not offering calculus was higher in 2021 than a decade earlier.
Figure 4.
Percentage of Schools Not Offering Calculus, by Low and High Black and Hispanic Student Enrollment
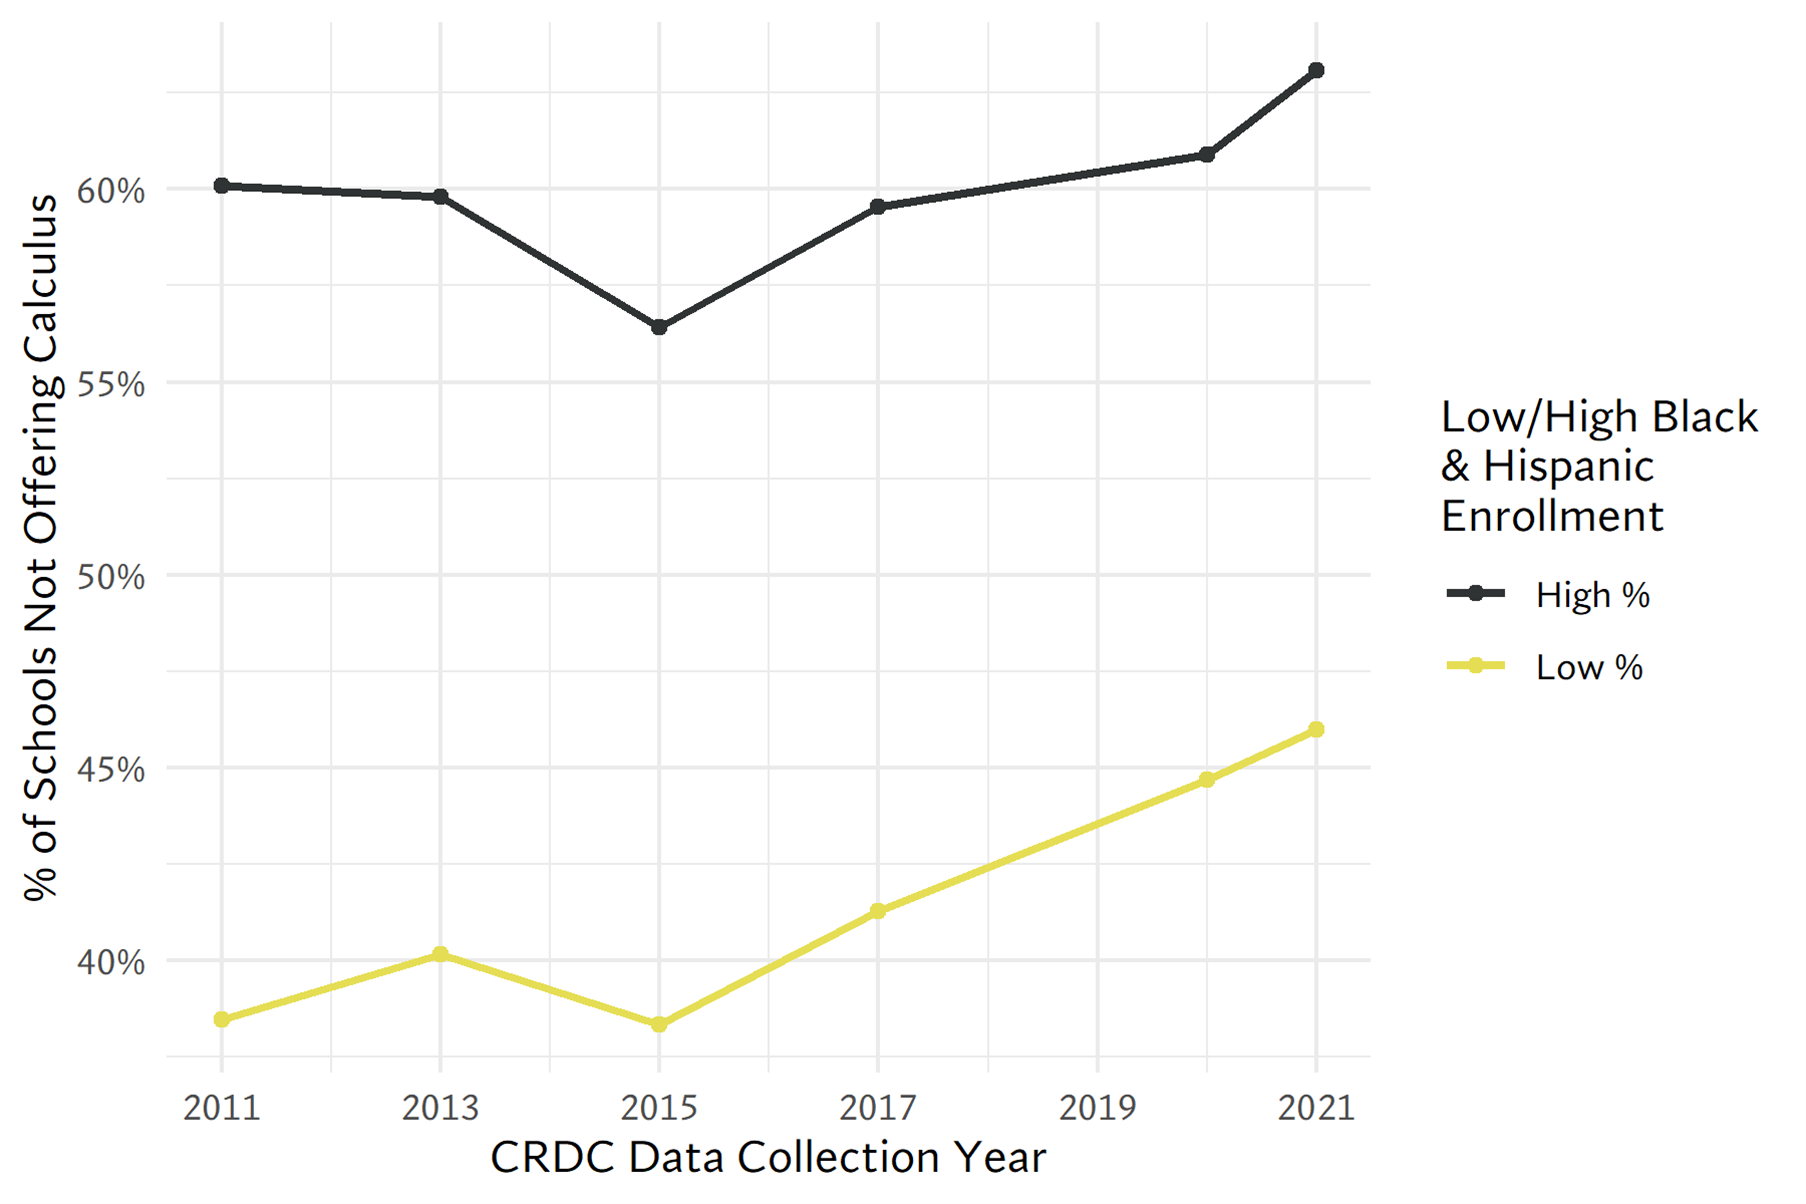
Source: H-CRDC V2.0 (2021-22) and Common Core of Data (2021-22).
Who is Enrolling in Calculus Courses?
Earlier data snapshots analyzing CRDC showed that, in addition to differences in where calculus was offered, enrollment in calculus courses has also had persistent gaps. In 2011-12, 8% of calculus students were Black even though Black students were 16% of the high school enrollment. Hispanic students likewise comprised 12% of the calculus enrollment but 21% of high school enrollment overall. White and Asian students were over-represented among calculus students.
These gaps in enrollment in calculus courses persist, by student race and gender, according to the latest data. White and Asian students are over-represented in enrollment of calculus courses, compared to all high school students. In 2021, Black students comprised less than 7% of all calculus students, but are almost 15% of high school enrollment. Hispanic students are 17% of calculus students but more than 28% of all high school students. Among Asian and white students, higher percentages of male students are enrolled in calculus, while the opposite holds for Black and Hispanic students (Table 1).
Table 1.
Racial and gender composition of high school students enrolled in calculus, 2021
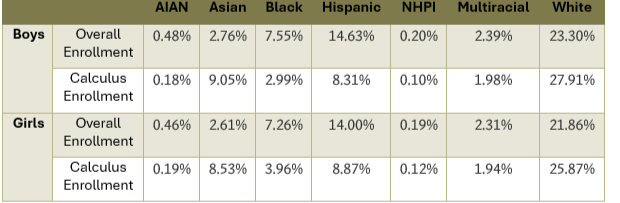
Source: H-CRDC V2.0 (2021-22) and Common Core of Data (2021-22).
Note: AIAN refers to American Indian and Alaska Natives; NHPI refers to Native Hawaiian and other Pacific Islanders.
Looking over time, we also see stubborn gaps in the percentages of students from each racial/ethnic group enrolled in calculus. During each of the survey years in the decade studied, more than 10% of Asian students in high school were in calculus and in some years up to 12%. The rate of white student enrollment was the second highest, but was less than half that of Asian students, under 5% each year. Black students were enrolled in calculus at the lowest rate, under 2% of students; only 2-3% of Hispanic students were also enrolled. For most groups, including Black and Hispanic students, the rate of enrolling in calculus was lower in 2021 than a decade earlier.
Figure 5.
Calculus Enrollment by Race, Nationwide
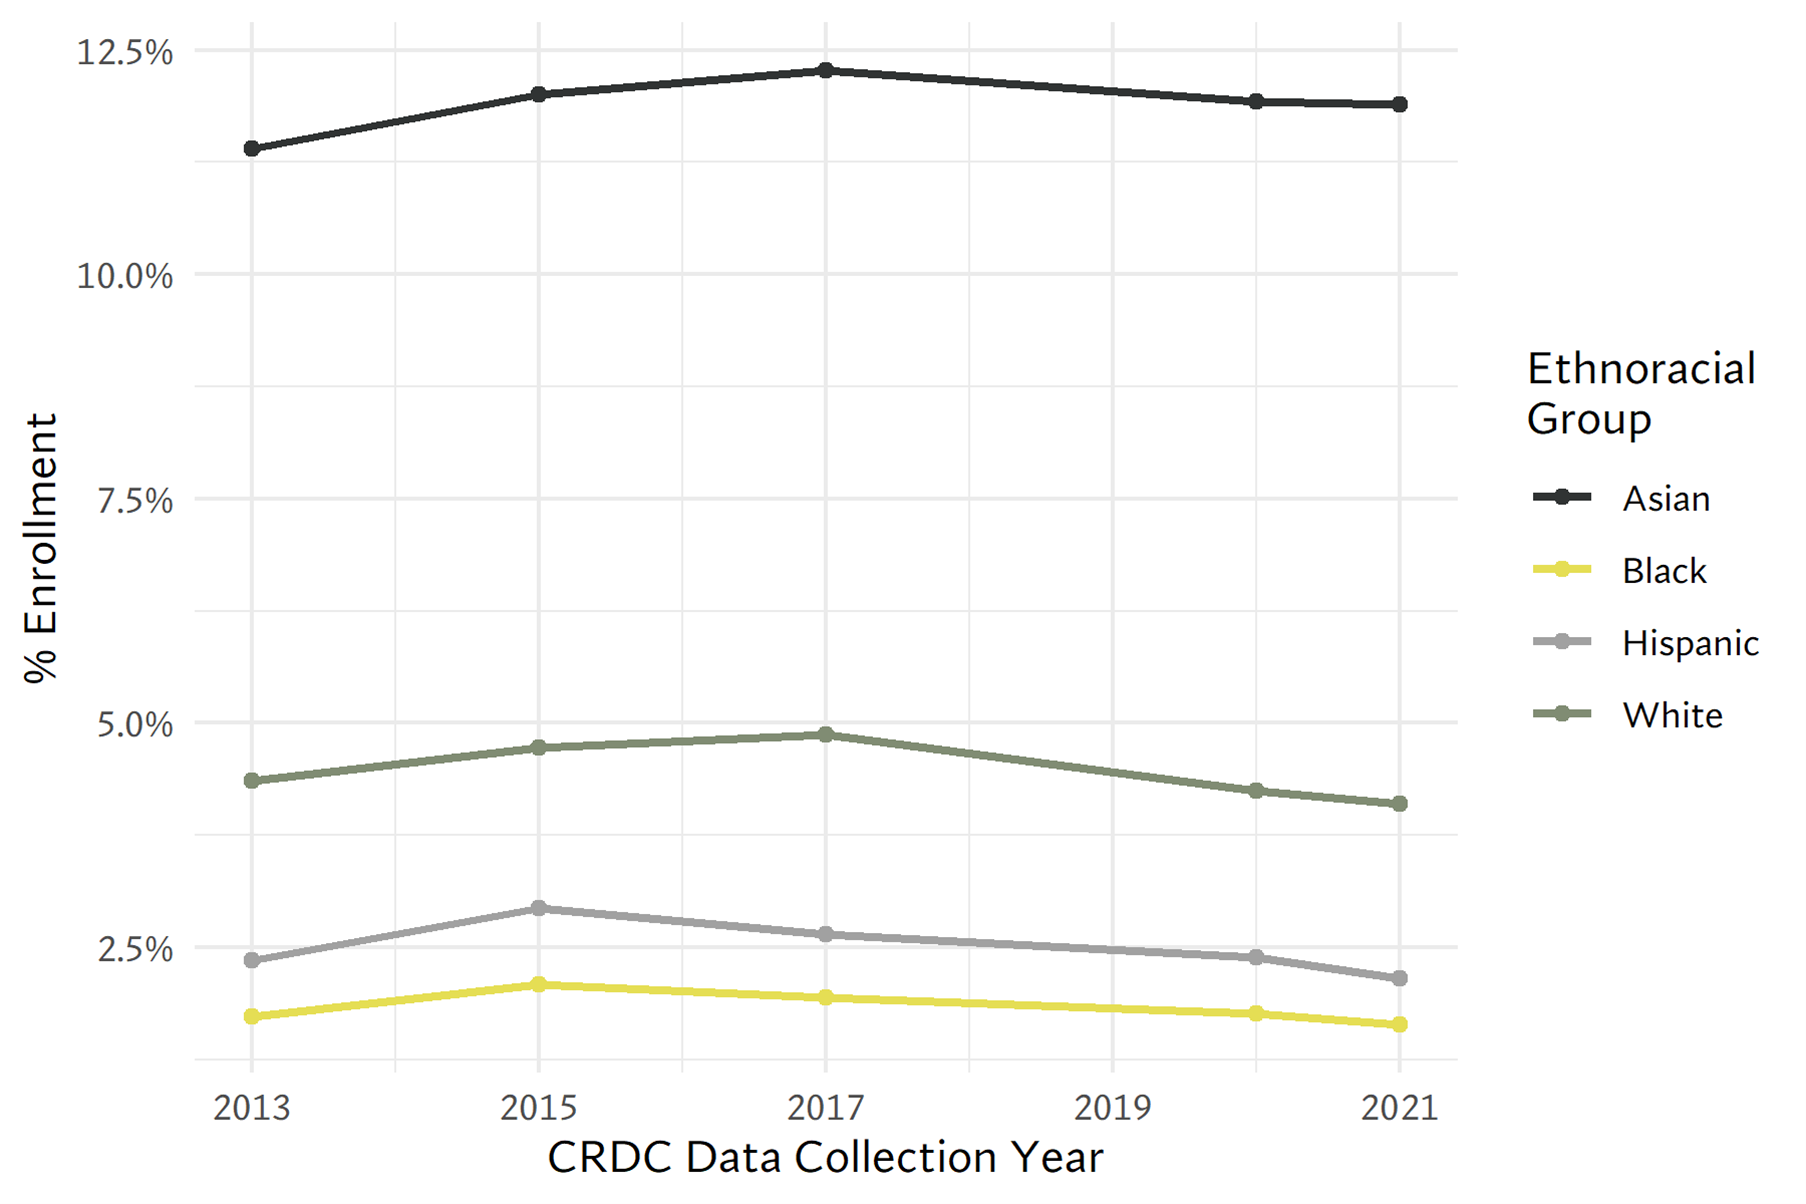
Source: H-CRDC V2.0 (2021-22) and Common Core of Data (2021-22).
Conclusion
Calculus is a core part of many college-going students’ high school experiences and may also be important for higher educational opportunities. Many students take it in high school as part of required or advanced-level coursework, especially in STEM-related fields or for K-12 students aiming to pursue a STEM-related field. Several factors hinder the ability for students to access quality calculus courses, such as their district and/or school offering few, if any, courses. Within schools, there might also be structures or practices impeding access to calculus and therefore affect whether students enroll in calculus if their school offers it. Equitably increasing student access to quality math, and specifically calculus, courses can help prepare students for the postsecondary life with the skills they need to succeed, whatever their own personal success looks like.
Notes
[1] We classified a school as a high school depending if it met one of the following conditions: it offered grade 12; it was labeled by the Department of Education’s Common Core of Data as a high school; or if the CRDC did not place an NA value in place of the number of calculus classes offered, which was indicator that a school would not have been qualified to offer calculus due to it being an elementary, middle, or some other category of school.
[2] The number of calculus courses was not collected in the 2013-14 and 2015-16 CRDCs. To establish whether calculus was offered somewhere in those years, a school was marked as offering calculus if they had a calculus enrollment larger than 0 students.
[3] To examine patterns by racial composition, we defined high Black and Hispanic enrollment school as one where 75% or more of students identify as either Black or Hispanic (following GAO’s definition) and low Black and Hispanic enrollment as under 25% of a school’s enrollment.