Who is labeled as Gifted? Trends and Patterns over the last Decade in US Public Schools
Understanding the Landscape of Gifted and Talented Programs over the last decade
Gifted and Talented (GT) programs are designed to challenge students who show exceptional ability in academics, creativity, leadership, or the arts. These programs offer enriched learning opportunities to help high-achieving students thrive. But how students are selected—and who gets included—varies widely. That’s because there are no federal definitions or rules about how GT programs should be run. Each state sets its own policies, and many of those policies leave plenty of room for interpretation at the local level.
This flexibility can lead to big differences in who gets access to GT programs. National data show that White and Asian students are more likely to be identified as gifted, while Black, Hispanic, Native American, and low-income students are less likely to be included—even when they perform just as well on tests. Student gifted identification rates also vary by teacher or principal’s race/ethnicity. These patterns raise important equity concerns.
Key Trends: Who Is—and isn’t—in Gifted Programs?
Using data from the U.S. Department of Education’s Civil Rights Data Collection (CRDC) that we harmonized over time, we examined national patterns in GT enrollment by race/ethnicity over the last decade [i]. We use school-level data from the biennial CRDC data from 2011-12 to 2021-22 (the most recently released wave of data), merged with the National Center for Education Statistics’ Common Core of Data (CCD), to analyze GT patterns by key student demographic and school geographic characteristics.
Our analysis found:
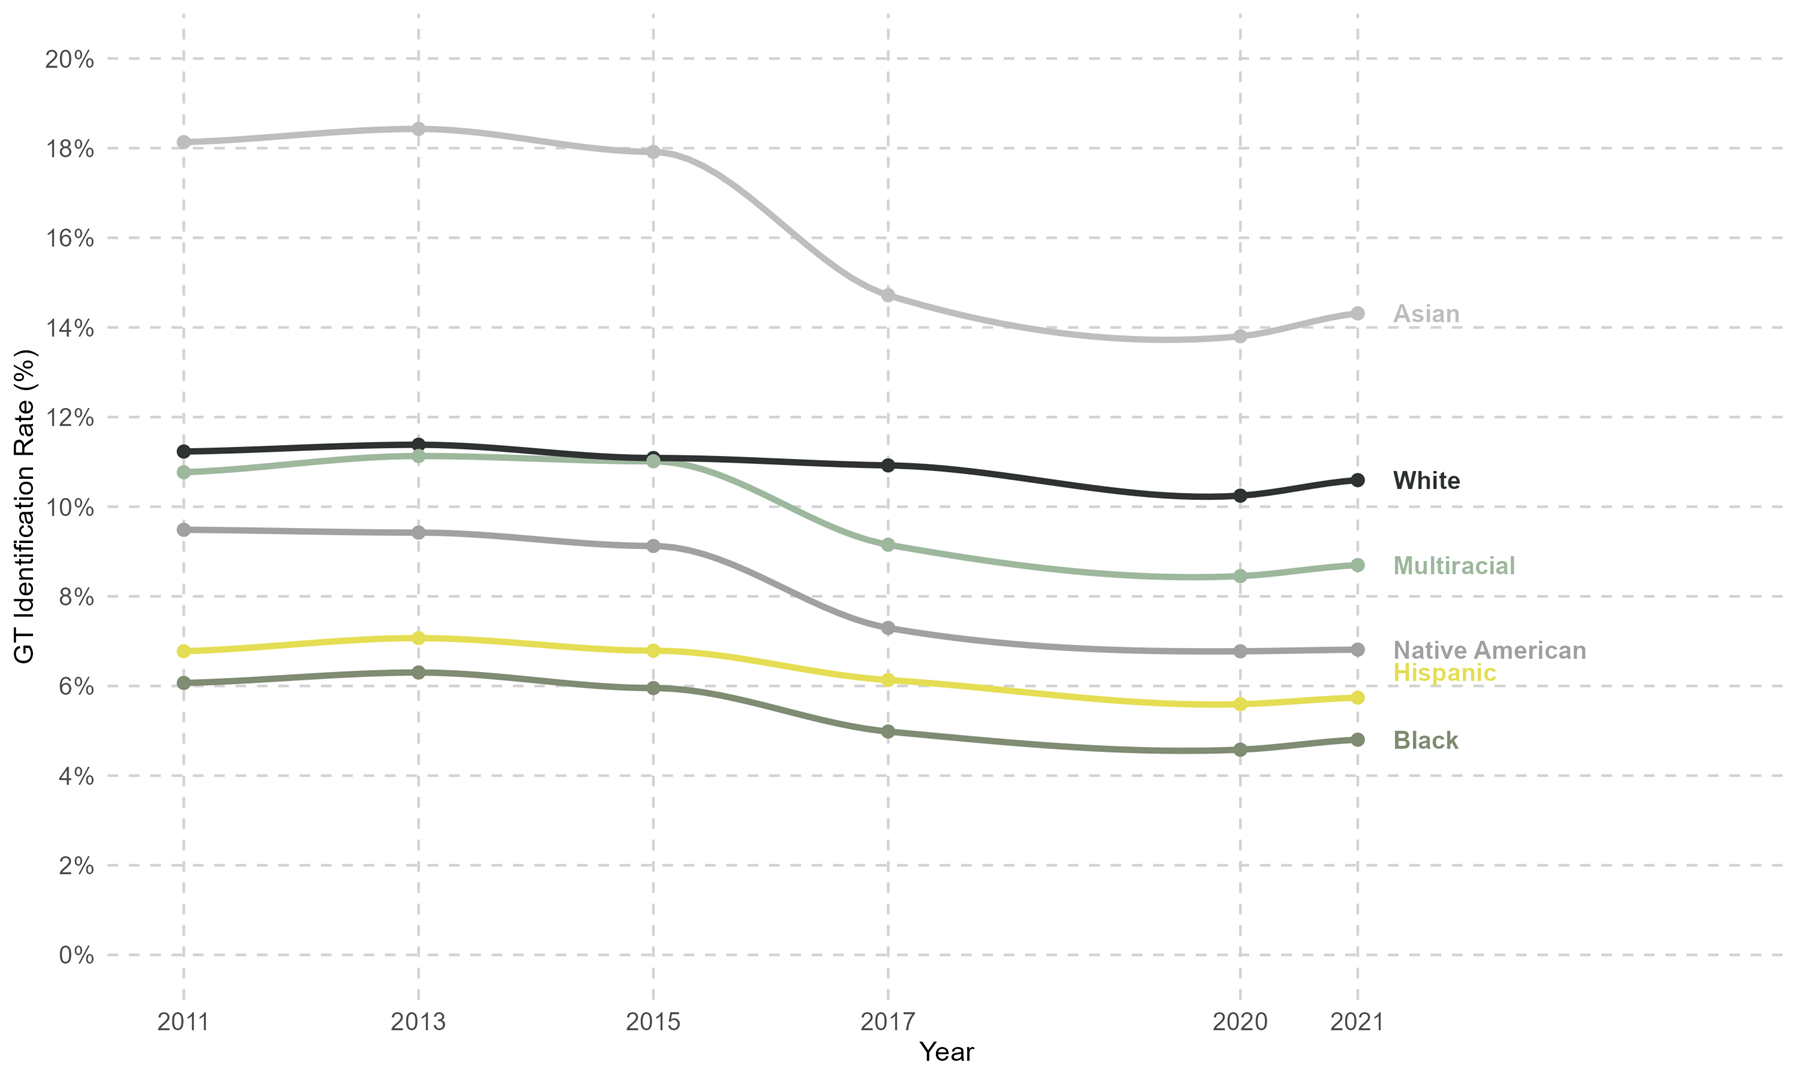
Persistent racial/ethnic gaps: Lower percentages of Black, Hispanic, and Native American students are identified as GT compared to White students—often two to three times lower across the last ten years.
Asian students are identified for GT at the highest rates, followed by White students.
GT identification rates have been falling since 2015 for most students (except White students whose rates have been largely stable across the decade). The declines are especially salient for Asian students. Even with these declines, racial/ethnic disparities in GT identification persist across this time period.
Figure 1.
Gifted and Talented Identification Rates by Race/Ethnicity (2011-12 to 2021-22)
Source: Civil Rights Data Collection (2011-12 to 2021-22)
Measuring Disparities: Comparative GT Identification Rates
We also looked at how each minoritized group’s enrollment compares to White students, using a ratio where 1.0 means proportional GT representation with White students, using a metric that has been used extensively in comparative analysis. A number below 1 means that group’s proportional representation is lesser than that of White students, and greater than 1 means that group’s proportional representation is greater than that of White students.
Over the last decade, in every biennial CRDC wave, Black, Hispanic, and Native American students had ratios below 1, showing they are less likely to be identified for GT programs as compared to White students.
These disparities have remained stubbornly consistent over time. Indeed, these ratios worsened again in 2017 and have stayed consistently low since then.
Only Asian students had ratios above 1 throughout the last decade, meaning they were identified for GT at higher rates compared to White students.
Multiracial students had ratios above 1 till 2017 but were under 1 in the last three CRDC waves.
Figure 2.
Gifted and Talented Comparative Identification Rates by Race/Ethnicity (2011-12 to 2021-22)

Source: Civil Rights Data Collection (2011-12 to 2021-22)
Urban, Suburban, and Rural Differences
When we looked at gifted enrollment across districts depending on what type of community they were located in, we found:
Rural districts tend to have the lowest GT identification rates overall (7.6%) compared to 8.9% in suburban districts and 8.6% in urban districts.
Regardless of district urbanicity type, we observe racial/ethnic disparities in GT identification.
Overall, the gap in identification for Black, Hispanic, Native American, and Multiracial students was wide and fairly consistent across geographic areas. In contrast, the rates for White and Asian students varied much more depending on location.
Figure 3.
Gifted and Talented Identification Rates by Race/Ethnicity and Urbanicity (2021-22)

Source: Civil Rights Data Collection (2021-22) and Common Core of Data (2021-22).
Note: Each dot represents the GT identification rate by race/ethnicity and urbanicity in 2021-22. Given the largely stable rates over time, to better understand the geographic differences and ease interpretation, we use GT identification rates data from just the latest CRDC wave.
Why Geography Matters: State Patterns
GT identification also varies by region and state. Here we include just the latest CRDC wave (2021-22) data for ease of interpretation as the longer-term trend (comparative trend across race/ethnicity) has remained fairly stable.
There is significant variation in the GT identification rates (both overall and by race/ethnicity) across the country with the lowest overall rate (1.98% in West Virginia) nearly 10 times smaller than the highest overall rate (19.33% in Maryland). See top left panel of Figure 4.
States with highest GT identification rates: Maryland (19.33%) followed by New York (17.19%), Minnesota (17.11%), Illinois (16.75%), and Virginia (14.93%).
States with lowest GT identification rates: West Virginia (1.98%), Hawaii (2.10%), Kansas (2.68%), Tennessee (2.79%), and Pennsylvania (3.52%).
In the bottom two panels, we use the White identification rates (shown in the top right panel) as a benchmark to show how the proportional identification rates by state for Asian students (bottom left) and Native American, Black, Hispanic, and Multiracial students (bottom right) compared with White students as described above.
Across states we find that Asian students are identified at higher rates and Black, Hispanic, Native American, and Multiracial students are identified at lower rates, as compared to White students, although the magnitude of disproportionality varies by state.
These differences reflect variation in state policies as well as local policies and practices when it comes to identifying students as gifted.
Figure 4.
Gifted and Talented Comparative Identification Rates by Race/Ethnicity and State (2021-22)

Source: Civil Rights Data Collection (2021-22).
Notes: Top-Left panel depicts the overall GT identification rates across states; Top-Right panel depicts the GT identification rates for White students across states; Bottom-left (right) panel depicts proportional identification rates (compared to white students) for Asian (Native/Hispanic/Black/Multiracial) students. Given the largely stable rates over time, to better understand the geographic differences and ease interpretation, we use GT identification data from just the latest CRDC wave.
Notes
(i) We exclude all school districts that report zero overall enrollment in Gifted and Talented Programs from our analytical sample.